
Much of the time, trying to place mission targets on a map can be an exercise in frustration. Mission maps are often not included in the narrative reports. Details of the attack are sometimes sketchy or minimal. Many place names have changed over the past 77 years making searches fruitless. When mission maps are included in the narrative reports the details of the base map are not always included. After exhausting all resources, sometimes mapping comes down to a best-guess estimate.
But then there are times when all the various pieces of the puzzle come together and produce a very accurate picture of an attack on a target. This is a particularly satisfying occurrence and fortunately they are frequent enough to help keep me focused.
The mission map below is from the 501st Bomb Squadron, 345th Bomb Group for March 21, 1945, when six of their airplanes took part in a raid on enemy shipping off Nha Trang, Indochina. At the top of the page there is mission information and along the right side are two latitude/longitude references. There is no map reference given to suggest the geographic coordinate system or projection used on the base map. Drawn on the map are the coastline, the paths that the various airplanes flew and also the locations of the enemy ships. The Time Over Target information indicates that they spent 15 minutes in the target area. 15 minutes doesn’t seem like much, but it might have seemed an eternity when enemy gunners were doing their best to shoot you down and machine gun tracers and flak filled the air.
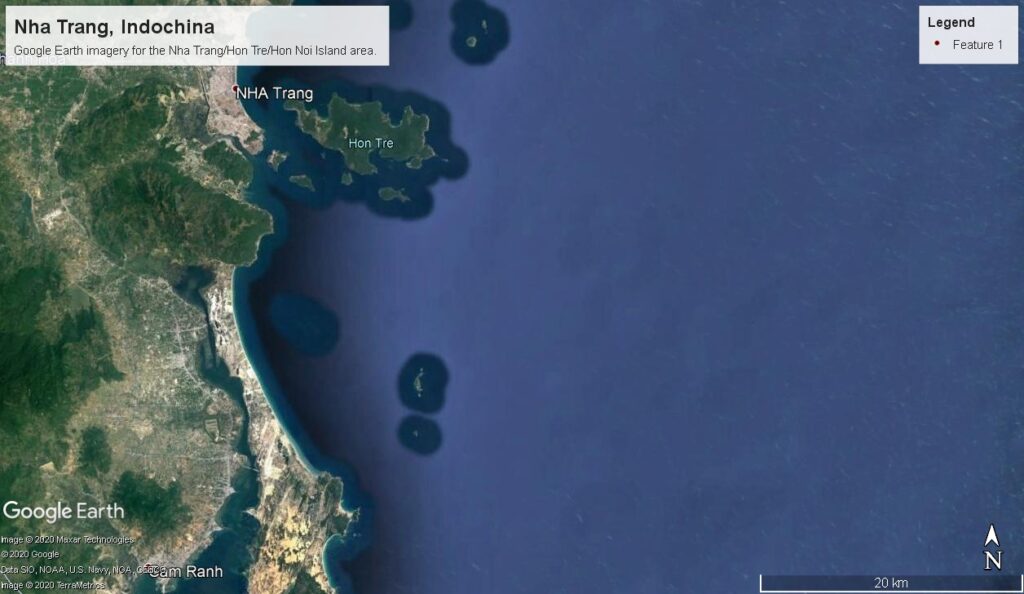
The same area can be found on Google Earth, from which we can obtain geographic coordinates in the current WGS-84 geographic coordinate system. Clearly shown are the coastline, the town of Nha Trang, Hon Tre Island and Hon Noi Island.
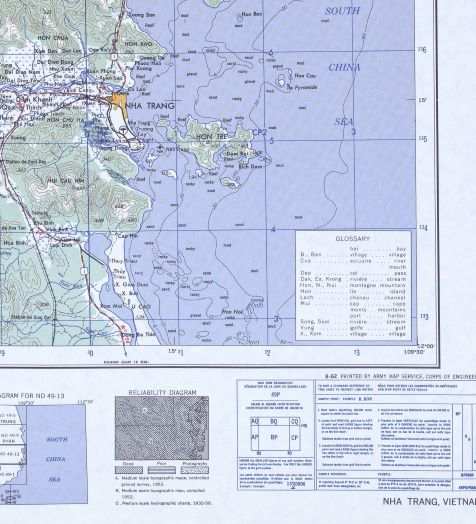
This 1:250,000 Army Map Service topographic map also covers the same area. Although it was compiled after the war, in 1956, it was based on older maps and shows the coastline and islands similar to what is shown in the mission map and Google Earth imagery. In the bottom right corner, and along the right edge, the same latitude/longitude coordinates are given as on the mission map.
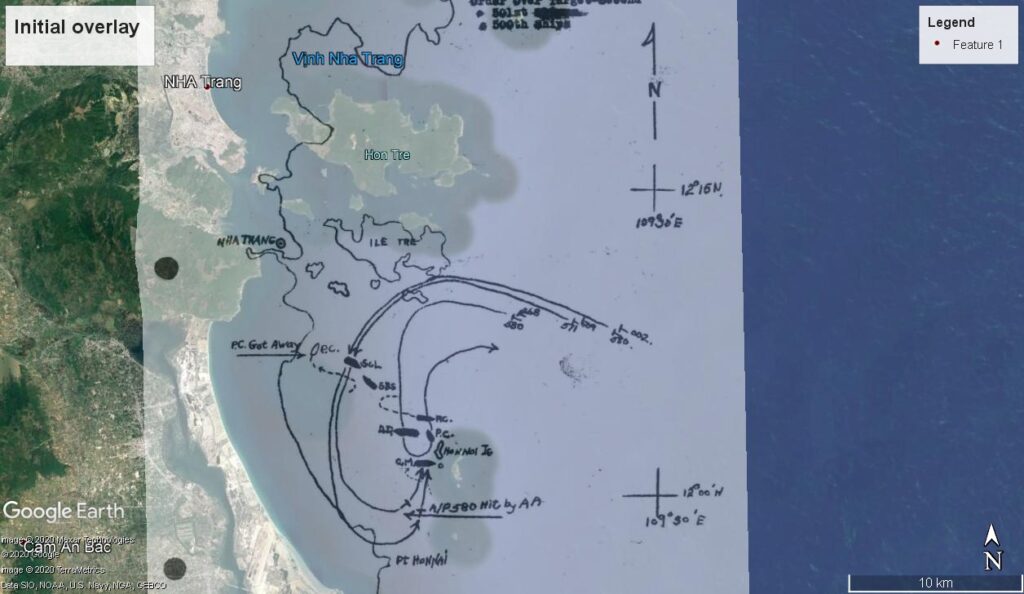
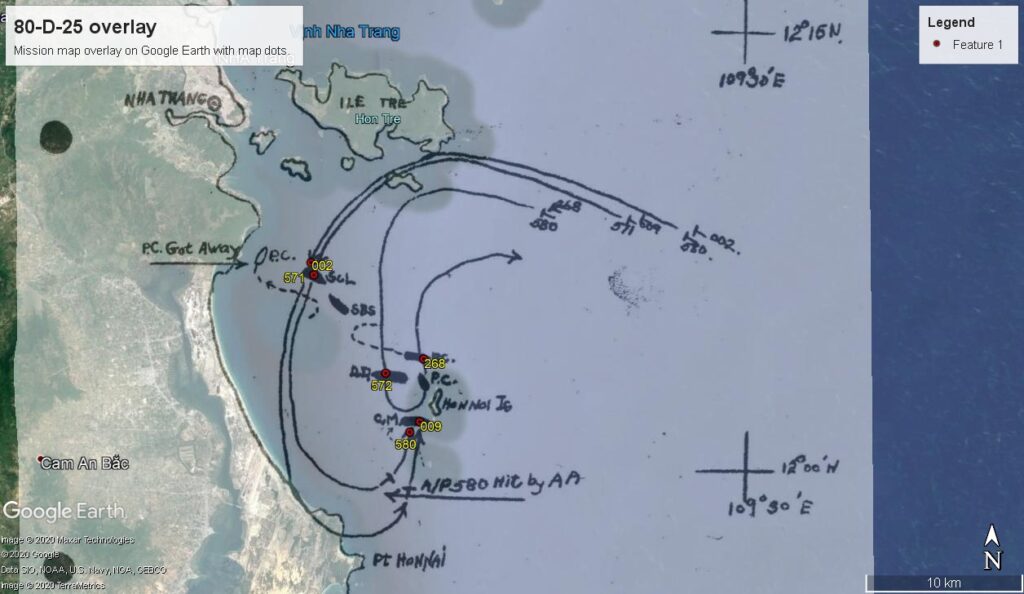
One of my favorite features of Google Earth is the ability to overlay maps and pictures over the satellite imagery. Below is an initial overlay of the mission map on Google Earth. The overlay is definitely smaller than the satellite imagery and while all the landforms are present, none of them are aligned.
During the overlay process, you can resize and rotate the image so that landforms, such as points along the coastline and islands, are aligned more accurately. When that is accomplished, the result is the most accurate depiction of the attack that can be derived from the available information. There is some confusion on this mission map as to which airplanes participated (580 is shown twice and 572 is missing). I used the text of the narrative report to sort that out.
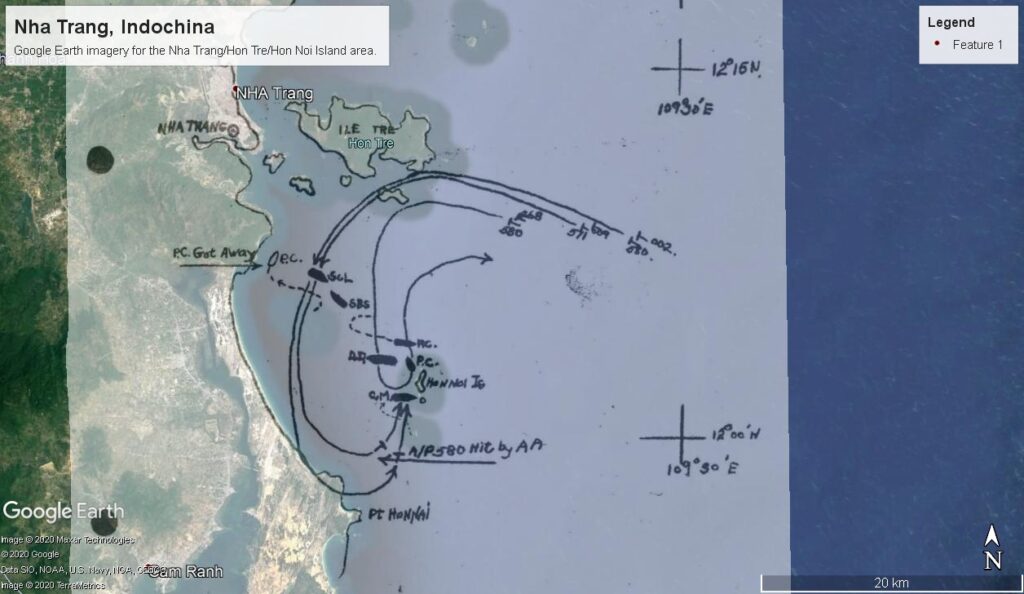
Once the overlay is reasonably aligned to the satellite imagery, then markers can be placed indicating where the individual airplanes dropped bombs. In this case, the narrative report provided an account of which airplanes attacked which vessels and included details as to whether the bombs struck forward/aft and port/starboard, allowing for a more accurate display of the attack. Each marker has an associated set of coordinates that I copied for use in my Esri ArcGIS maps.
The main variable affecting accuracy is the unknown geographic coordinate system or map projection used in the original mission map. While plotting the coordinates given in mission reports can get you close to a target location, you can never be certain of your accuracy. You would certainly be close enough to get you in the general area but if you were searching for a target that was away from the coastline in the open ocean, that unknown amount of error would make any result a very rough estimate.
Below, the mission and topographic maps have been overlaid on the satellite imagery and different colored map pins have been placed to indicate the reference coordinates on each. There is a 2000 to 3000 foot difference between the mission map and Google Earth pins. There is a similar difference between the mission map and topographic map pins. I point this out because if coordinates from this mission report were plotted directly in a modern program such as Google Earth, then the apparent location of an event would be several thousand feet to the southeast of where it would have been shown on the original map.
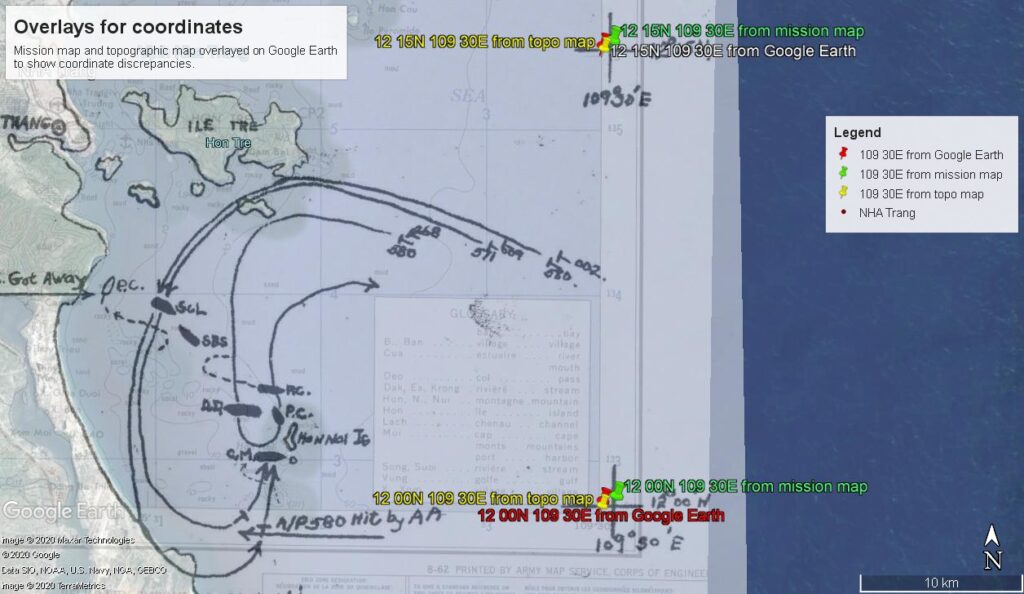
This doesn’t mean there is any one of the pin placements more accurate than the others, but it does indicate that the mission map was traced from a base map that was based on a different geographic coordinate system or map projection. Using old mission coordinates to plot target locations could lead to some misleading results unless some allowance for this offset is calculated and applied. This is a topic that I do not yet have a full understanding of other than knowing that different coordinate systems and map projections “stretch” a flat map of the earth’s surface in different ways. An example would be the difference in the apparent size of North America and Africa on a Mercator projection map versus the same countries on a equal-area type map like a Gall-Peters or a Robinson projection map.
Despite the coordinate discrepancies, overlaying and aligning maps seems to be an effective way of displaying this WW2 mission data.