There were nine bombardment groups assigned to V Bomber Command of the Fifth Air Force during the course of WW2. These units flew a variety of aircraft that included the A-20 Havoc, A-26 Invader, B-25 Mitchell, B-26 Marauder, B-17 Flying Fortress, and B-24 Liberator bombers. For the purposes of driving the Japanese from their strongholds in the Pacific, the Fifth Air Force began their task around the northeast coast of Australia and then proceeded along the island chains from New Guinea in a generally northward and westward direction.
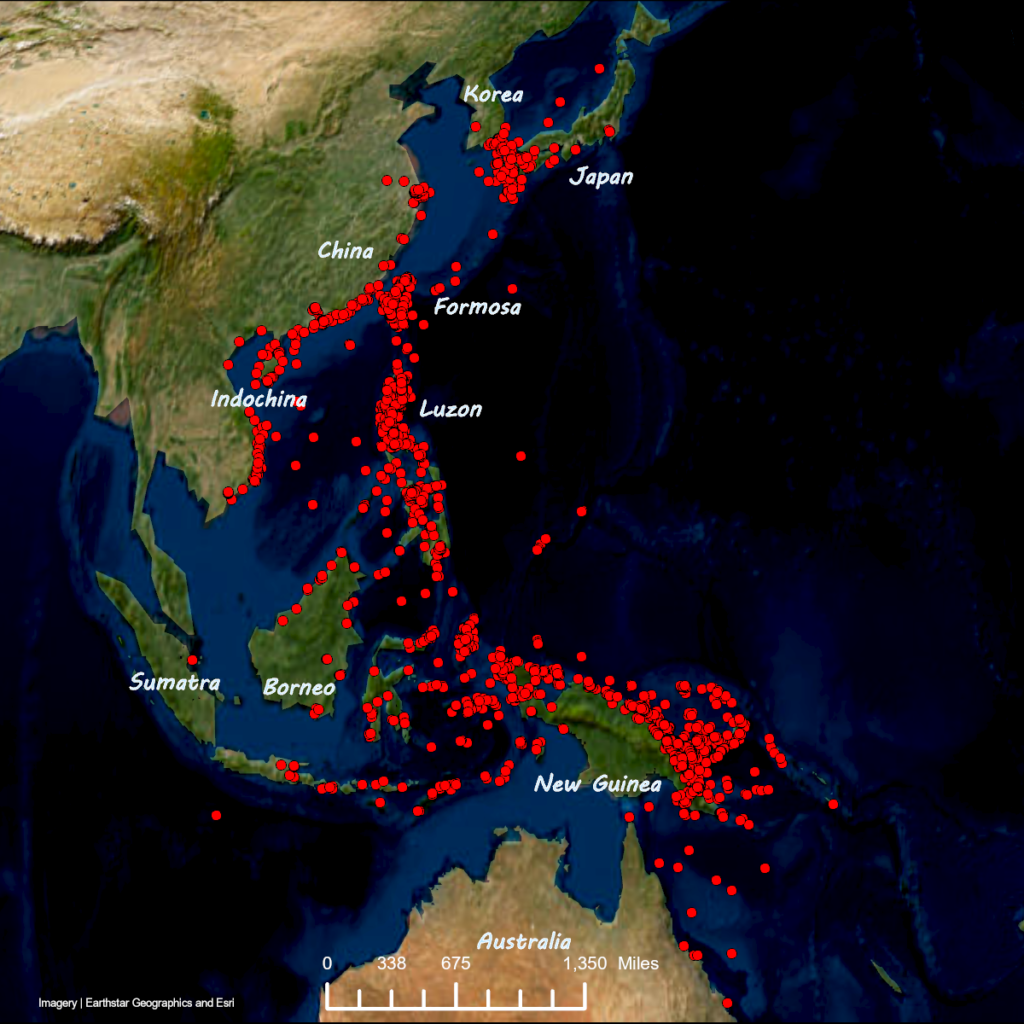
Roughly 6,300 targets had been derived from mission reports and unit histories then mapped according to their parent bomb groups. In this version of the data, the entire database is presented on one map in an effort to display not only the extent of the battle area, but to also indicate the most heavily targeted areas.

The map above shows one red dot for each of the 6,319 mission targets. Many of the dots are clumped and clustered along shorelines to such an extent as to render them individually indistinguishable.
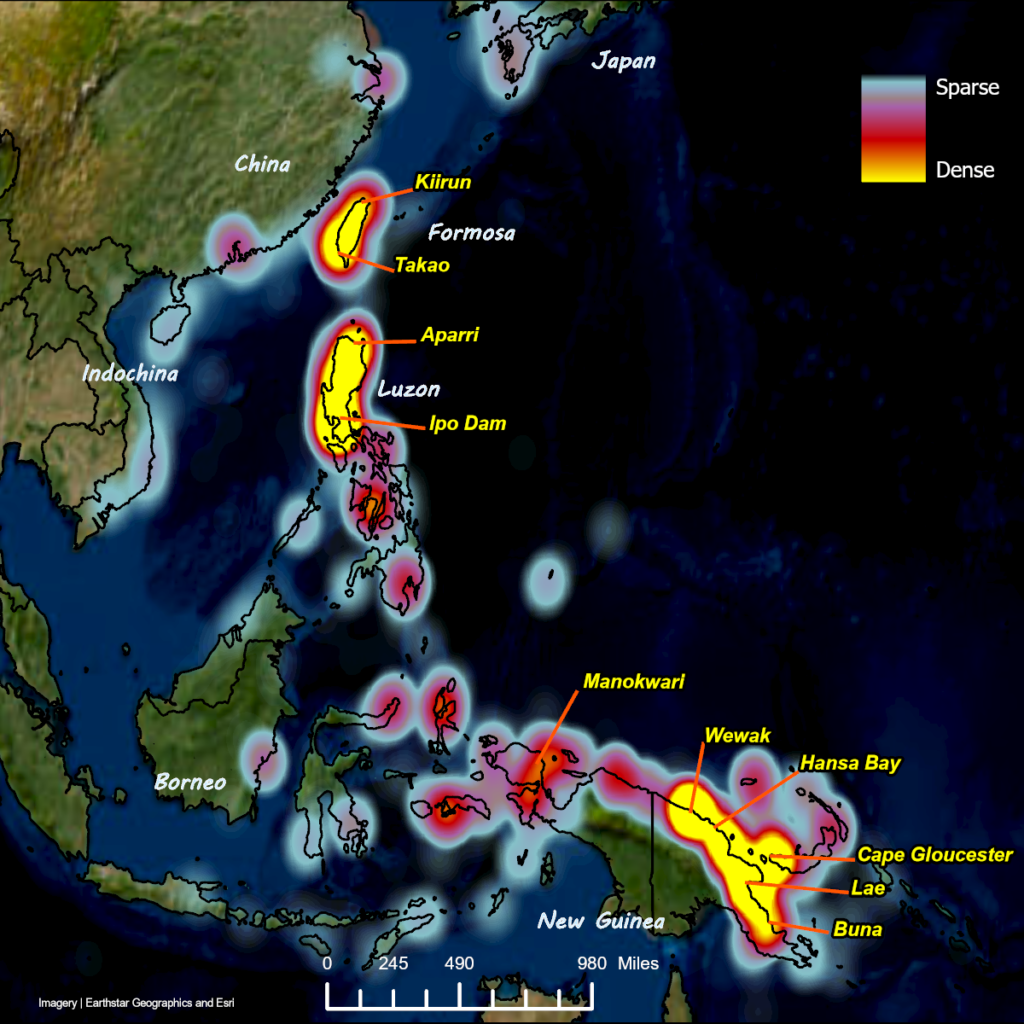
In an effort to take advantage of the clustering to show the most heavily attacked areas, several geoprocessing tools were used to produce maps displaying results of those analyses. A layer showing country borders was added to assist in area identification.
The first tool produced a basic heat map. The most densely clustered targets are depicted as yellow shaded areas. The least clustered targets are shown in the washed out blue tones while red shading indicates a medium amount of clustering. Labels have been added to indicate some frequently visited targets in each hot spot.

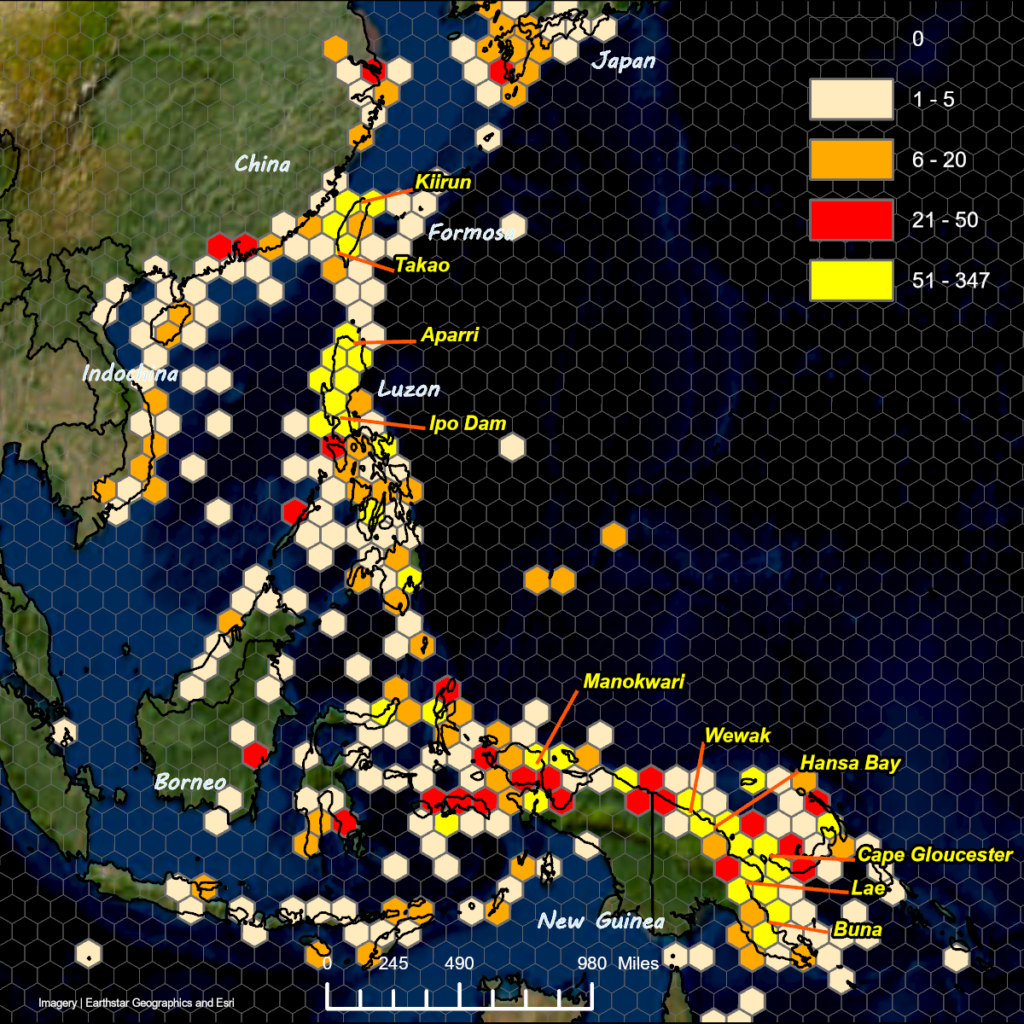
The second geoprocessing tool was more involved and was based on overlaying a grid of hexagons on the map area and then determining how many target dots fell within each hexagon (each hexagon covered an area of approximately five hundred square kilometers).
The resulting map was color coded using yellow and red for the two most clustered areas and orange and tan for the two least clustered areas. This method produced a generally similar pattern of hot spots with some notable additions, such as the Manokwari area of Dutch New Guinea. Presumably, decreasing the area of the hexagons could produce a more precise display of target hot spots.

Three major hot spots are identified by these maps: the north coast of New Guinea; the island of Luzon; and the island of Formosa.
The New Guinea town of Wewak, along with the airdrome, was the single most targeted location at 175 occurrences. If the closely associated airdromes of Boram, But, and Dagua are included, that total rises to 330 mentions. Other high density target areas in New Guinea were: Lae (110); Hansa Bay (90); Cape Gloucester (81); and Alexishafen (75).
On the Philippine island of Luzon, the Balete Pass area had the most targets with 41 instances. Other dense target areas on Luzon were: the Ipo dam area (35); Tuguegarao (33); San Fernando (32); and Aparri (31).
On Formosa, Takao was the most frequently targeted area with 63 instances. Other dense target areas on Formosa were: Kiirun (38); Taihoku (38); Tainan (32); and Mako (27).
